

Case Study: Addiction Treatment Centers of Maryland
Real-time clinical and administrative data
Addiction Treatment Centers of Maryland provides medication-assisted treatment and counseling services for opioid addiction. With three clinic locations (Genesis Treatment Services in Frederick, A Helping Hand, and Genesis Treatment Services in Westminster), management and employees needed up-to-the-minute data to best treat patients, monitor clinical effectiveness, and keep up with compliance requirements. While the company’s EHR system could track data for individual patients, extracting and filtering aggregated data was a challenge.
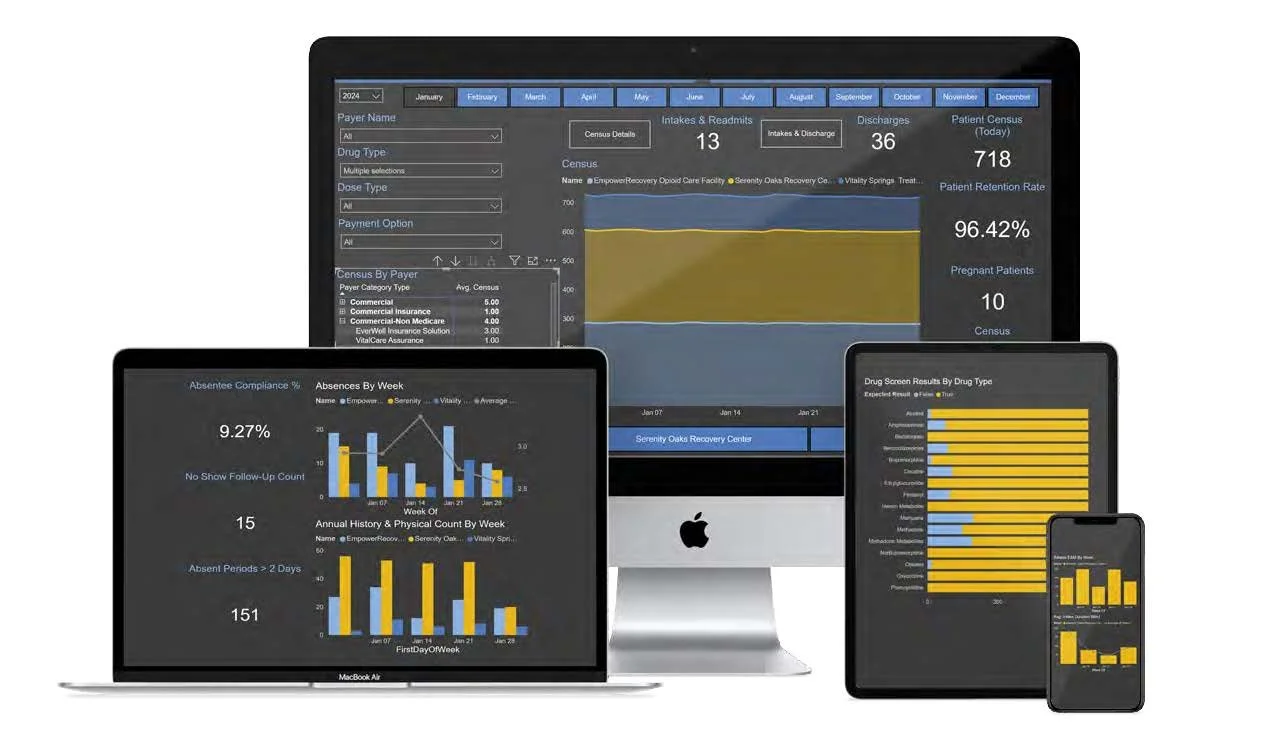
To solve this issue, Reimagined Consulting partnered with Netsmart, the parent company of the EHR system Methasoft. The two companies piloted a tool that uses Microsoft’s Power BI to extract and visualize the clinical and employee data that had been locked up in individual patient records. Now, with real-time aggregated data accessible through intuitive, easy-to-use interfaces, Addiction Treatment Centers of Maryland can optimize operations, identify potential issues, and ultimately provide better care for its patients.

Opportunity
Seeking real-time clinical and administrative data
Like many health organization CEOs, Joel Prell of Addiction Treatment Centers of Maryland often found himself stymied by a lack of readily available data in real time. While he valued Methasoft, the EHR software used by Genesis for 20 years, Prell found that extracting data from the software could be a time-consuming process.
“To get really detailed data from Methasoft—you can get it, but you have to run these reports. And then you have to export it to a spreadsheet, format it, put in formulas, and it’s a lot of work,” Prell said. “We always made it work, but it took hours on end every month.”
Not only was preparing the data time consuming, but Prell and his team could never look at aggregated, up-to-the-minute data; they had to rely on the previous month’s numbers. The data showed trends, but not always in a way that made for timely interventions.
“With three clinics to run, I need some kind of number measurement,” Prell said. “But we monitor everything from the financial aspect to the clinical aspect. I want to know how the counselors are doing, the drug dosing results, how efficiently the nurses are operating, and more.”
For administrative and reporting purposes, clinical employees also need data filtering capabilities. For instance, if any patient in a counselor’s caseload tests positive for fentanyl, ideally the counselor would be able to see that data immediately, rather than having to search individually within each patient’s chart. Having effective performance measurement is also important for maintaining accreditation with the Commission on Accreditation of Rehabilitation Facilities (CARF).
So when Netsmart, the owner of Methasoft, approached Prell to ask if Genesis wanted to be part of a pilot program for an operations dashboard that visualizes real-time clinical data, Prell jumped at the chance.
Solution
A visually rich means to access data
Working with Netsmart, Reimagined developed a platform that could be customized for different healthcare providers. The Reimagined team created an operations dashboard using Microsoft’s Power BI that aggregates the data in Methasoft patient charts and presents it in an easy-to-understand visual format. For Addiction Treatment Centers of Maryland, the operations dashboard has a number of different pages, including a patient census screen with graphics showing weekly missed appointments, billable E&M, average intake duration, and more.
Results
Improved patient care, operations, and compliance
With real-time data now accessible in an easy-to-understand visual format, Addiction Treatment Centers of Maryland can track patient issues like missed appointments and intervene immediately with a phone call to check in. It can compare operations like average dosing time or dose administration by each clinician from week to week, identifying trends and targeting areas for improvement. And it can identify and follow up on “red flag” issues like lapsed insurance authorizations to meet reporting requirements. Ultimately, more readily accessible data helps Addiction Treatment Centers of Maryland and other providers provide better quality care for patients
Instantly access patient and employee data in easy-to-understand charts
Identify “red flag” patient issues like missing documents, expired insurance authorizations, missed appointments, health changes, etc.
Identify trends in key performance indicators
Stay on top of reporting and accreditation requirements